The impact Heads Up has on creating genuinely outstanding schools
Only 6% of schools gain or maintain the Ofsted ‘outstanding’ judgement
24% of schools Heads Up have supported have gained or maintained their outstanding judgement
How did we calculate the impact Heads Up has on schools versus the average?
1. In 2020 we analysed Ofsted reports from 2014 to 2019.
Why 2014? Because this is when the first schools Heads Up had worked with started to get inspected.
2. Which schools were included?
State infant, junior, primary, secondary and special schools.
3. We removed any schools that did not have a previous and/or current Ofsted grade.
Why? So that we could measure the change in grade between current and previous inspections.
Analysis of school Ofsted grades 2014-19
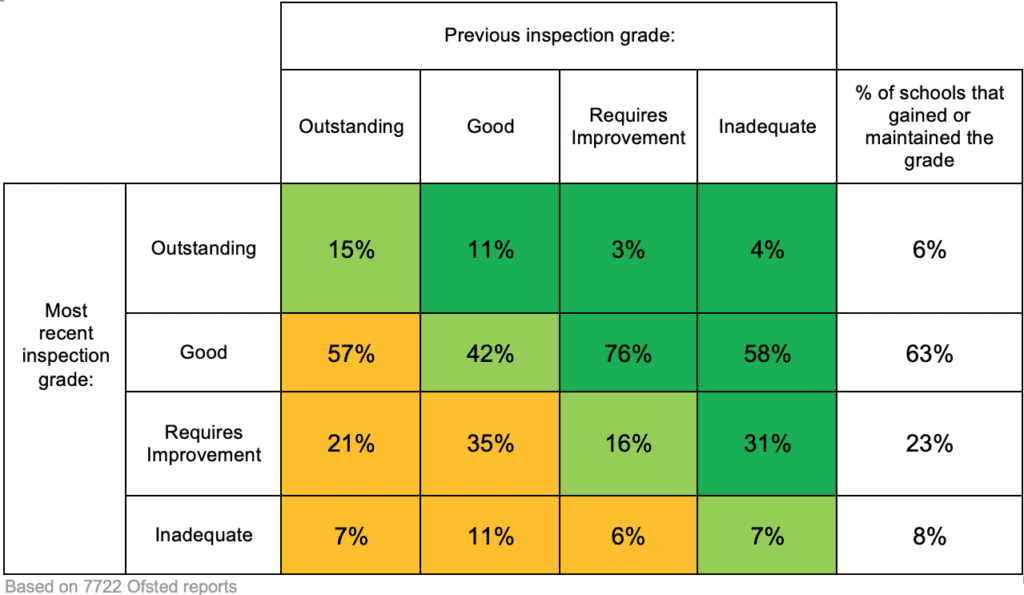
How to read this table
The horizontal axis shows how a school was judged previously.
The vertical axis is the latest grading.
The light green boxes show schools who stayed at that grade.
The dark green boxes show an improvement in grade.
The amber boxes show a decrease in grade.
Conclusions:
You can see that 6% of schools gained or maintained their outstanding grade.
63% gained or maintained their ‘good’ grade
23% dropped to or stayed at ‘requires improvement grade’
8% dropped to or stayed at ‘inadequate’
We also analysed how many schools gain or maintain their good or outstanding grade: 67%.
For Heads Up schools it’s 95%.
Analysis of Ofsted grades 2014-19 for schools Heads Up has supported
We looked at the Ofsted grade for the schools we have supported with on our ‘Journey to Outstanding’ programmes during the same time frame.
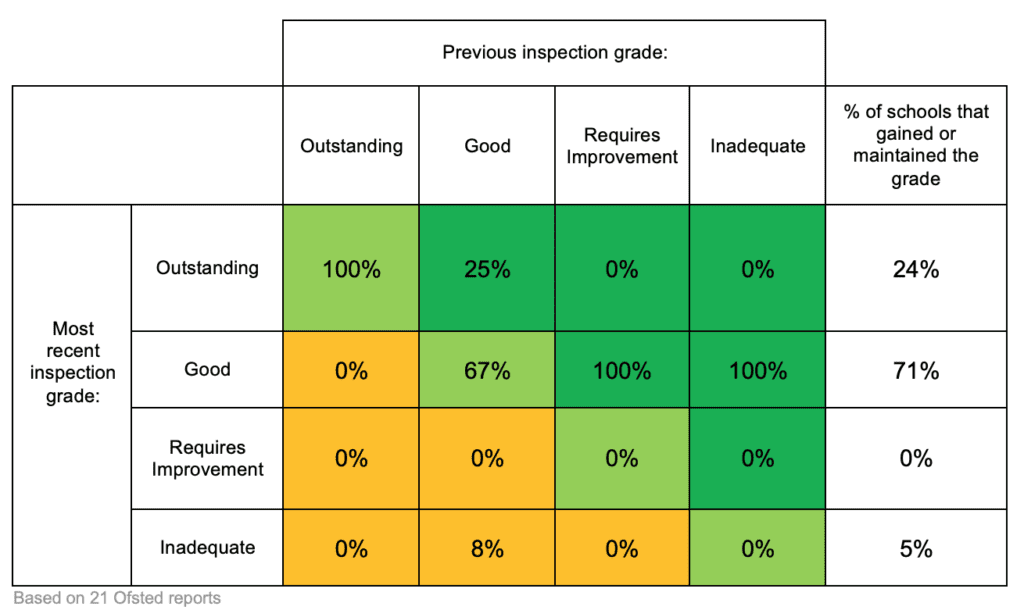
Conclusions:
You can see that 24% of schools gained or maintained their outstanding grade.
71% gained or maintained their ‘good’ grade.
0% gained or maintained their ‘requires improvement grade’.
5% dropped to ‘inadequate’.